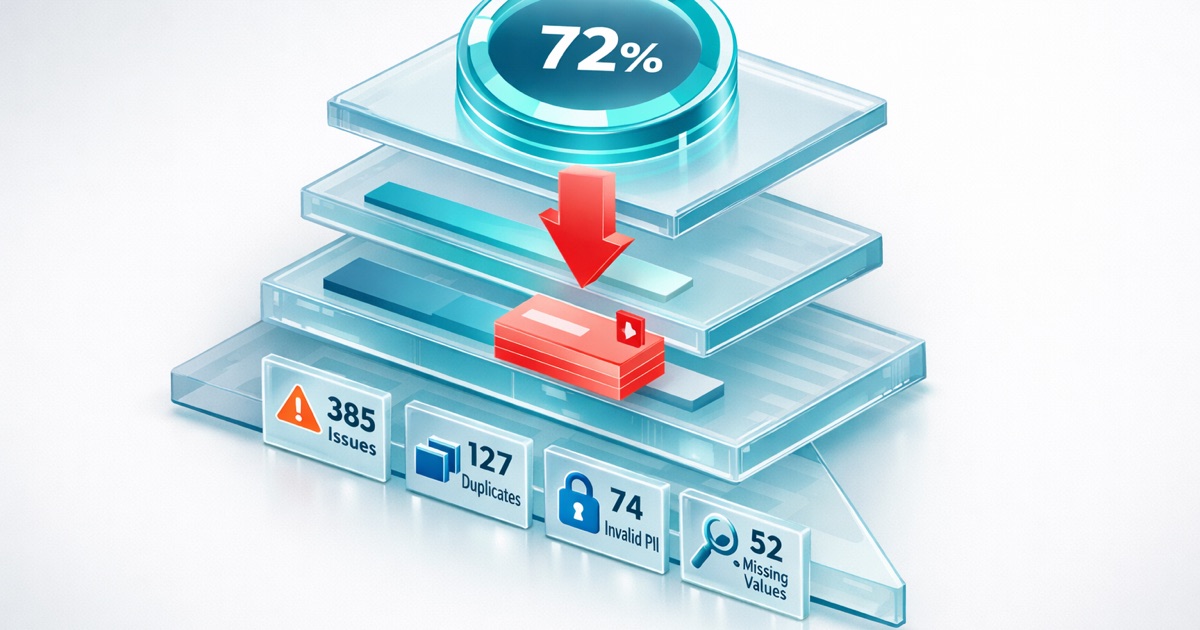
Results Overview
After a scan completes, DQS presents your results in a dashboard view. The dashboard shows scores at multiple levels:
- Overall Score - Single number representing total data quality
- Dimension Scores - Scores for each capability (Completeness, Validity, etc.)
- Field Scores - Scores for each analyzed field
- Record Details - Drill-down to specific affected records
The Results Dashboard
Dashboard Layout
┌─────────────────────────────────────────────────────────────────┐
│                     OVERALL QUALITY SCORE                        │
│                           85%                                    │
│                     ▲ +3% from last scan                         │
├──────────────────────┬──────────────────────┬───────────────────┤
│    COMPLETENESS      │      VALIDITY        │    UNIQUENESS     │
│        92%           │        78%           │       95%         │
├──────────────────────┼──────────────────────┼───────────────────┤
│    TIMELINESS        │    CONSISTENCY       │   AI READINESS    │
│        88%           │        82%           │       76%         │
└──────────────────────┴──────────────────────┴───────────────────┘
Accessing Results
- Open DQS from the App Launcher
- Find your Definition in the list
- Click the Definition name
- Select the Results tab
- Choose a scan date to view
The most recent scan shows by default.
Overall Quality Score
The overall score is a weighted average of all dimension scores.
How It’s Calculated
DQS uses default weights for each dimension:
| Dimension | Default Weight |
|---|---|
| Completeness | 25% |
| Validity | 20% |
| Uniqueness | 20% |
| Timeliness | 15% |
| Consistency | 20% |
Formula: Overall = (Completeness x 0.25) + (Validity x 0.20) + (Uniqueness x 0.20) + (Timeliness x 0.15) + (Consistency x 0.20)
AI Readiness scores are shown separately and don’t affect the Data Quality overall score.
Score Interpretation
| Score Range | Quality Level | Action |
|---|---|---|
| 90-100% | Excellent | Maintain current practices |
| 80-89% | Good | Address specific weak areas |
| 70-79% | Fair | Prioritize improvement |
| 60-69% | Poor | Immediate attention needed |
| Below 60% | Critical | Major data cleanup required |
Trend Indicator
Next to your score, you’ll see a trend arrow:
- Green arrow up - Score improved from last scan
- Red arrow down - Score declined from last scan
- Gray dash - Score unchanged
The percentage shows the change amount.
Dimension Scores
Click any dimension card to see detailed metrics.
Completeness Metrics
| Metric | Type | What It Shows |
|---|---|---|
| Completeness Rate | Percentage | Fields that have values |
| Populated Count | Number | Records with data |
| Incomplete Count | Number | Records missing data |
| Null Rate | Percentage | Fields that are NULL |
| Blank Rate | Percentage | Empty or whitespace only |
| Placeholder Rate | Percentage | N/A, TBD, Unknown values |
Example interpretation:
- Completeness Rate: 85% means 15% of records are missing values
- High Placeholder Rate suggests users enter “TBD” instead of real data
Validity Metrics
| Metric | Type | What It Shows |
|---|---|---|
| Validity Rate | Percentage | Values matching expected format |
| Valid Count | Number | Records with correct format |
| Invalid Rate | Percentage | Values not matching format |
| Invalid Count | Number | Records with format errors |
Example interpretation:
- Validity Rate of 78% on Email field means 22% have format issues
- Common issues: missing @, spaces, typos like “.con”
Uniqueness Metrics
| Metric | Type | What It Shows |
|---|---|---|
| Uniqueness Rate | Percentage | Distinct vs total values |
| Distinct Count | Number | Number of unique values |
| Entropy | Decimal | Value diversity (higher = more diverse) |
| Max Frequency | Number | Most common value occurrence |
| Rarity | Percentage | How rare values are distributed |
Example interpretation:
- Uniqueness Rate of 95% means 5% are duplicates
- Low Entropy suggests many records share the same values
Timeliness Metrics
| Metric | Type | What It Shows |
|---|---|---|
| Freshness Rate | Percentage | Records within freshness window |
| Staleness Rate | Percentage | Records past freshness window |
| Average Age | Days | Mean age of date values |
| Recency Rate | Percentage | Records updated recently |
| Future Rate | Percentage | Records with future dates (errors) |
| Overdue Rate | Percentage | Records past expected update |
Example interpretation:
- Staleness Rate of 30% means 30% of records haven’t been touched in your freshness window
- Future Rate above 0% indicates data entry errors
Consistency Metrics
| Metric | Type | What It Shows |
|---|---|---|
| Conformance Rate | Percentage | Values matching expected patterns |
| Conformance Count | Number | Records that conform |
| Non-Conforming Count | Number | Records with variations |
| Variant Count | Number | Different value variations found |
| Dominant Values | JSON | Top values and their counts |
Example interpretation:
- Variant Count of 15 on Country field suggests inconsistent entry (USA vs United States vs US)
- Dominant Values shows which variations are most common
AI Readiness Metrics
PII Detection:
| Metric | What It Shows |
|---|---|
| Records with PII | Absolute count of records with pattern matches (for remediation scoping) |
| PII Exposure Rate | Percentage of records containing PII (for compliance reporting) |
Field-Level Details
Click a dimension to see per-field breakdown.
Field Score Table
| Field | Score | Issues | Actions |
|---|---|---|---|
| 92% | 234 invalid | View Records | |
| Phone | 78% | 1,456 invalid | View Records |
| MailingCity | 95% | 180 missing | View Records |
Reading Field Scores
Each field shows:
- Score - Performance for this field
- Issues - Count of problematic records
- Actions - Links to drill-down and export
Identifying Problem Fields
Sort fields by score (lowest first) to find:
- Fields with most issues
- Fields needing immediate attention
- Patterns across related fields
Tip: Focus on high-impact fields first. A 10% improvement in Email validity has more business value than perfecting a rarely-used field.
Drill-Down to Records
Click View Records to see affected data.
Record List View
The drill-down shows records with issues:
| Name | Issue | Created Date | |
|---|---|---|---|
| John Smith | john.smith@example |
Invalid format | 2026-01-15 |
| Jane Doe | jane.doe@mail,com |
Invalid format | 2026-01-20 |
Filtering the Record List
Filter by:
- Issue type (missing, invalid, duplicate, etc.)
- Date range
- Owner
- Custom field values
Direct Record Access
Click any record to open it in Salesforce. Make corrections directly or assign to the appropriate team member.
Comparing Results Over Time
Trend Charts
DQS displays trend charts showing:
- Overall score over time
- Dimension scores over time
- Field scores over time
Charts help you:
- Track improvement progress
- Identify declining areas
- Measure impact of cleanup efforts
Scan Comparison
Compare any two scans:
- Click Compare on the Results tab
- Select a baseline scan (older)
- Select a comparison scan (newer)
- View side-by-side metrics
The comparison highlights:
- Improved metrics (green)
- Declined metrics (red)
- Unchanged metrics (gray)
Setting Improvement Targets
Use historical data to set realistic targets:
| Current Score | Realistic 90-Day Target |
|---|---|
| Below 60% | 70-75% |
| 60-70% | 75-82% |
| 70-80% | 82-88% |
| 80-90% | 90-94% |
| Above 90% | Maintain or 95%+ |
Exporting Data
You can export results for offline analysis and cleanup workflows.
CSV Export
Export options:
- Summary Export - Scores and metrics only
- Affected Records Export - Full list of records with issues
- Field Detail Export - Per-field breakdown
How to Export
- Open scan results
- Click Export (download icon)
- Choose export type
- Select format (CSV)
- Download the file
Export Contents
Affected Records Export includes:
- Record ID
- Record Name
- Field with issue
- Issue type
- Current value
- Suggested action
Example row:
0031x00000ABC123,John Smith,Email,INVALID_FORMAT,john.smith@example,Fix email domainUsing Exports for Cleanup
- Export affected records to CSV
- Open in Excel or Google Sheets
- Review and correct values
- Use Data Loader to update Salesforce
- Re-run scan to verify improvements
Tip: Create a cleanup assignment workflow. Export records, assign owners based on Account or Region, and track corrections.
Sharing Results
Sharing Options
Share results with stakeholders:
- Link sharing - Copy URL to scan results
- Screenshot - Dashboard view for presentations
- Export - CSV for detailed analysis
- Email summary - Automated reports
Creating Reports for Leadership
For executive presentations, focus on:
- Overall score and trend
- Improvement from previous period
- Top 3 problem areas
- Action plan with timeline
Avoid overwhelming with metric details. Lead with the story.
Understanding Score Changes
Why Scores Change
| Change | Common Causes |
|---|---|
| Score improved | Cleanup efforts, better data entry |
| Score declined | New data with issues, changed thresholds |
| Big jump up | Bulk data cleanup completed |
| Big drop down | Data import with quality issues |
Investigating Changes
When scores change unexpectedly:
- Compare scans to identify which metrics changed
- Drill down to field level
- Review recent data changes (imports, integrations)
- Check if Definition configuration changed
Next Steps
- Definition Builder: Adjust thresholds based on findings
- Running Scans: Schedule regular scans
- Measuring Data Quality: Build a quality scorecard